
If you don’t know about polyphasic sleeping read this first. Today I slept very well. I had REM on all naps, and two nice periods of REM in the core sleep (It may be true that doing 3:20 instead of 3:00 core sleep on Everyman has benefits. One of the readers seems to think so).
- sleep phase diagram with zeo … missing naps 🙁
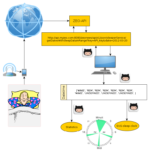
Anyway, I keep having some problems with the headband (or Dry EEG to record the sleep phases). The machine is quite astonishing, light and comfortable. But the developers had a big blind spot when it comes to designing the database. The charts above are not the output of their website. All the charts you see here are practically done by hand. I have to copy paste, adapt, scroll, select by color, open, crop about 4 times. All that to make a little chart like that one!! The reason is pretty simple. Zeo thinks that everybody is monophasic. So they will only save the longest period of sleep. If you don’t pay special attention to your naps and record them on separate files they will just disappear from the record. Not good for polyphasic sleep, of course. So if you stop the alarm and put the headband in the docking station. POUF! Gone. I did remember the length of the naps, and the dreams (REM) at the end of it. So I’ve drawn in beige a rough estimate of the nap. Anyway … I’m going to develop my own scripts to record the data and do my charts automatically. This is roughly how it will work:

My headband talks to the phone and docking station. Then my phone uploads the data to their website. I use their website API to pull the data back to my computer regularly (I have to check if I can grab the full naps or just the core sleep). Then I convert it to a useful format, merge it with my personal subjective observations, and create automatic charts from the data with SVG-fig. Wherever you see the funny cat it means I will share this code on Github (a place for developers to share and collaborate). Anyway, I’ll keep you posted. When I’m done I’ll share the code so anybody can plot their own data this way. Wish me luck!
(2012/03/19, (2:30, 6, “just woke up”), (3:50, 7, “reading”), (4:27, 6, “computer work”), (5:40,5,”getting tired for reading”), (6:27,4,”ready for nap”), (7:35,5),(7:50,7),(8:30,7.5), (11:30,7.5), (12:00,5),(13:00,7.5),(17:00,6,”tired eyes and light headache”) … all good until 22:30.)
3 Comments
Leave a reply →